

🌾 No sign-up required. No eligibility screening. No cost to you — ever.
Available to all Ontario producers. Simply connect with us and get started.
Do Any of These Sound Familiar
Ontario farmers lose an estimated 15–30% of potential yield every year to problems that are identifiable — and fixable.

Uneven Yields Across Fields
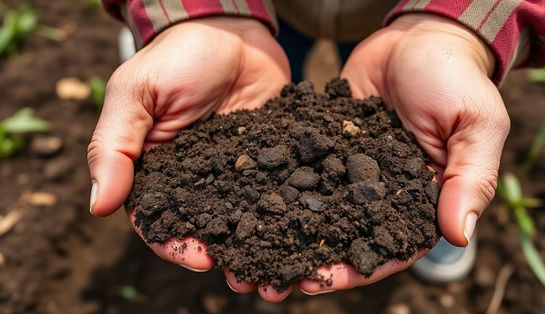
Your best field consistently outperforms your worst by 30–50 bu/ac of corn, but you can't pinpoint why. The answer is almost always below the surface — in soil structure, compaction layers, or drainage class differences.

Standing Water & Slow Drainage
Fields that pond after rain events or stay wet well into spring are losing critical growing days. In Ontario's clay plains (Brookston clay, Beverly clay loam), poor internal drainage and inadequate tile spacing are the most common causes of yield suppression.

Compaction Zones Restricting Roots
Tillage to the same depth year after year creates a hardpan layer that restricts root penetration, limits water infiltration, and reduces nutrient uptake. Most Ontario farmers have compaction — they just can't see it from the cab.

Fertilizer Costs Rising, Returns Flat
You're applying more nitrogen than ever, but yields aren't responding. On compacted or poorly drained soils, up to 40% of applied N can be lost through denitrification, leaching, or surface runoff — money literally leaving the field.

Eroded Knolls & Whitecaps
Those lighter-coloured hilltops in your fields aren't just cosmetic — they represent decades of tillage erosion that has stripped away productive topsoil. Ontario soils have shallow profiles (<70 cm). Every centimetre of topsoil lost is devastating.

Yields Plateauing Despite Best Efforts
You've adopted the latest genetics, adjusted fertility rates, and timed your planting — yet yields flatline. The problem isn't agronomy above the surface. It's soil physical condition: bulk density, porosity, aggregate stability, and biological activity.
We Compare Your Best Field to Your Worst — Then Tell You Exactly Why They Differ
The Farmland Health Check-Up uses a proven benchmarking approach: you select one high-performing field and two underperforming fields. A Certified Crop Advisor then evaluates all three across ten critical assessment areas — from soil structure and compaction to erosion risk and nutrient management.
By comparing your fields against each other and against county yield averages, we isolate the specific factors limiting production in your problem fields. This isn't guesswork — it's diagnostic agronomy based on OMAFRA Best Management Practices and real Ontario soil science. Learn more about the 3-field comparison approach →
Soil type mapping using Ontario county soil survey data
Slope classification and erosion risk assessment
5-year crop rotation and tillage history analysis
Subsurface compaction testing and bulk density measurement
Drainage class evaluation and water infiltration testing
Organic matter levels and soil biology assessment
Real Example: Oxford County
John Smith of Rolling Acres Ltd. in Norwich, Oxford County, selected three fields across 296 acres. His "Home" field (105 ac, Crsil loam) consistently yielded 131 bu/ac wheat vs. a county average of 94.1. His "Hutchinson" field (109 ac) on heavy clay with variable drainage was producing only 170 bu/ac corn vs. 220 on his best field. The FHCU identified subsurface compaction from years of full-disturbance tillage and inadequate tile drainage spacing as the primary yield-limiting factors.
What the Check-Up Evaluates
Using the official FHCU digital workbook, we evaluate your three selected fields across ten critical areas of farmland health — each one a potential source of yield loss.

Water Erosion
Evaluate risk of soil loss from rainfall and runoff

Wind Erosion
Assess vulnerability to wind-driven soil displacement

Tillage Erosion
Measure soil movement from tillage on slopes

Subsurface Compaction
Identify compaction layers restricting root growth

Organic Matter
Track organic matter levels for long-term fertility

Soil Life
Evaluate biological activity and soil ecosystem health
Soil Chemistry
Analyze pH, CEC, and nutrient balance

Phosphorus
Manage P levels for crop needs and water quality

Nitrogen
Optimize N management for yields and environment

Pollinator Health
Support pollinator habitat and biodiversity
WHAT YOU WALK AWAY WITH

Actionable Intelligence — Not Just Another Soil Test
The Farmland Health Check-Up goes far beyond a standard soil test. You receive a comprehensive field-by-field diagnostic report that identifies exactly where yield is being lost and provides prioritized, practical recommendations based on OMAFRA Best Management Practices. See the full list of deliverables →
Complete Field Assessment Report
A detailed workbook covering all ten assessment areas for each of your three fields, with baseline scores and improvement targets.
Yield-Limiting Factor Identification
Specific diagnosis of what's holding back your underperforming fields — whether it's compaction at 15 cm, inadequate tile spacing, or organic matter depletion.
Prioritized BMP Recommendations
Practical, ranked steps to address each issue — from strategic deep tillage to cover crop species selection to drainage improvement planning.
Connection to Grants & Programs
Direct linkage to Ontario cost-share programs like SARFIP and CFFO stewardship programs that can fund recommended improvements.
ONTARIO SOIL SCIENCE
Built on Real Ontario Agronomy — Not Generic Advice
Ontario's agricultural soils have often less than 70 cm of weathered material — making them particularly vulnerable to degradation from intensive cropping and tillage.
The province's dominant landforms — till plains (Guelph loam, Wellington County), clay plains (Brookston clay, Kent County), sand plains (Fox sand, Brant County), and end moraines — each present distinct management challenges. A Brookston clay requires fundamentally different compaction management than a Guelph loam. The FHCU accounts for these differences.
Historically, Ontario's mixed farming systems maintained soil health through regular organic matter additions from sod and manure. By the 1950s, the shift toward continuous row cropping, increased tillage intensity, and heavier equipment began the decline in soil physical condition that many farms continue to experience today.
"Ontario soils are young and relatively shallow, often with a thin layer of topsoil over dense subsoil. These soils are fragile; therefore soil management is critical to long-term sustainability."
— Dr. G.J. Wall, Agriculture and Agri-Food Canada
How the Check-Up Works
A straightforward process designed to provide maximum value with zero cost to you.
Contact Us
Reach out to schedule your free Farmland Health Check-Up. No paperwork, no eligibility screening — all Ontario farmers qualify.
Select Your Fields
Together we identify your least challenging field and two most challenging fields. This gives us a clear baseline and targets for improvement.
Field Assessment
Your Certified Crop Advisor evaluates each field across 10 key health indicators including soil health, erosion risk, nutrient management, and pollinator support.
Receive Your Report
You receive a comprehensive workbook with tailored recommendations and best management practices to improve yields and field health.


100%
Free to All Ontario Farmers
3
Fields Compared Per Assessment
10
Critical Assessment Areas
15-30%
Typical Yield Loss Identified
Your Trusted Advisor
Agronomy and good farming practices are our passion. We bring deep expertise and recognized credentials to every assessment.

Certified Crop Advisor (CCA)
With 4R CCA Nutrient Stewardship and Integrated Pest Management (IPM) specializations


NASM Plan Development
Qualified to generate plans for the application of Non-Agricultural Source Materials